A research blog about the geocrimedata project; taking existing geospatial data making it useful for crime analysis. Funded as part of the JISC GeoSpatial Infrastructure programme.
Monday, 22 August 2011
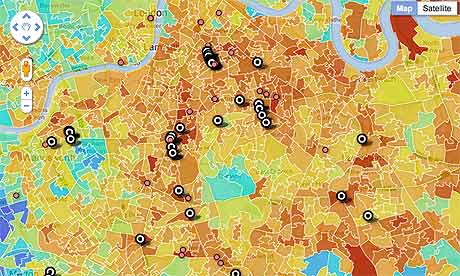
Mapping riot locations using publicly available data
Following the riots in England, the Guardian newspaper have mapped the locations of some of the people charged with related offences and have compared them to deprivation data (the Index of Multiple Deprivation). This is an interesting and extremely relevant use of publicly available data.
Subscribe to:
Post Comments (Atom)
"collecting courts data for people accused of riots" It is the home addresses along with the locations of the riots which *is* interesting, but you could say of *only* those caught/accused.
ReplyDeleteHas anyone mapped the location of riots/accused-homes with a comparison background of crimes over a year or so. I.e. Were the riots by people living in places of high-rates/similar-types of crimes?
The change in deprivation is very showing, that they are not just areas that are poor but areas that have become poorer. Did crime levels change as they became poorer?